Browse help topics
Export data to CSV
Build a custom table from a dataset and export it to CSV.
Last updated · 2 August 2026
The Data export tab is a custom table builder. You pick a dataset, choose which columns to include, optionally sort and filter, preview the rows, then export them to CSV.
Open the Data export tab
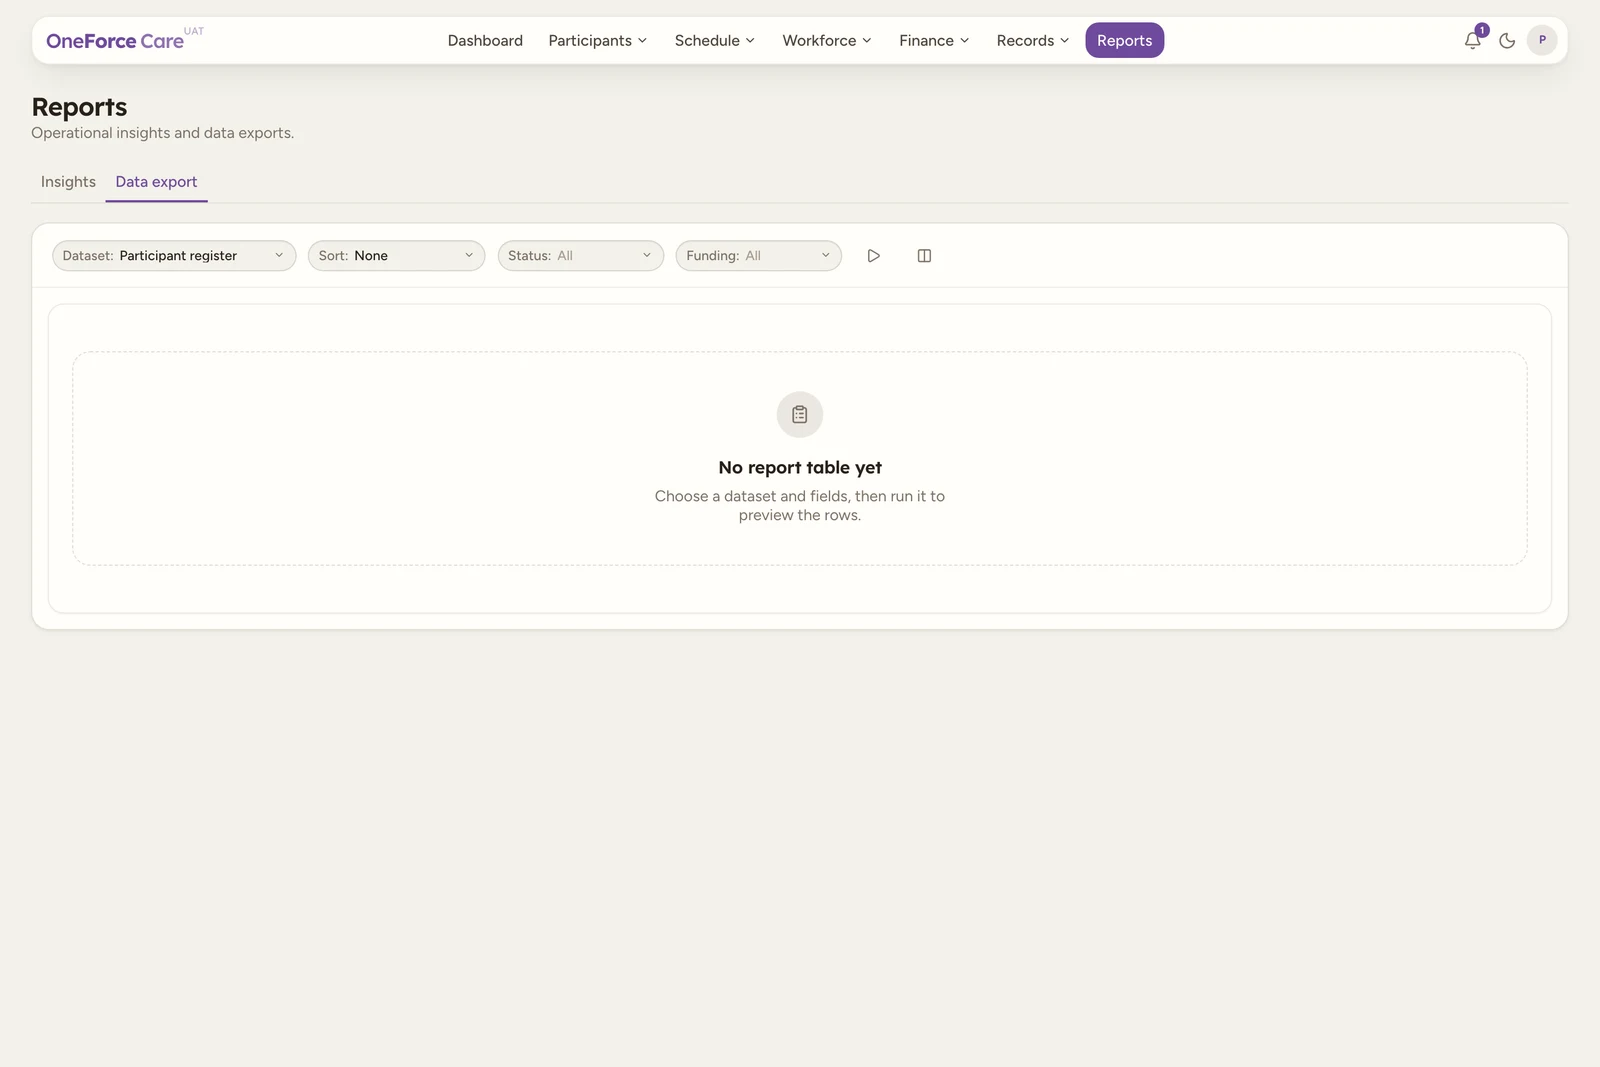
Go to Reports and select the Data export tab. Before you run anything you see No report table yet: “Choose a dataset and fields, then run it to preview the rows.”
Choose a dataset
Open the Dataset picker and choose what to export. Participant register is selected when you arrive. It is a single list of 15 datasets, with no section headings in the dropdown itself; grouped below by subject for reference:
| Group | Datasets |
|---|---|
| People & care | Participant register, Worker directory, Contacts and organisations, Scheduled supports, Operational tasks, Incident register, Participant enquiries |
| Finance & documents | Document register, Invoice readiness, Audit trail, Service agreements, Plan budgets, Invoice batches, Payments |
| Scheduling | Cancellation log |
Each dataset has its own set of fields and its own quick filters, so the rest of the row changes when you switch dataset.
Choose the fields (columns)
Select the Fields column icon to open the picker. It is headed Fields, with a running count of how many of the 12 you have selected next to it (for example “Fields (5/12)”), and lists every column the dataset offers. The first five fields are ticked by default.
Tick the columns you want. You can pick up to 12. Once 12 are selected, the remaining checkboxes are disabled until you untick one.
Sort and filter (optional)
Two more controls sit in the filter row:
- Sort: choose any sortable field, or leave it on None. When you pick a field, an Order dropdown appears so you can switch between Ascending and Descending (Ascending by default).
- Quick filters: each dataset adds its own categorical dropdowns. For Participant register these are Status and Funding, each defaulting to All. Choosing a value narrows the table to matching rows.
Run the table
Select the Run table play icon. It stays disabled until at least one field is selected, so there is no way to run an empty table by mistake.
The preview shows up to 100 rows per page. When more rows are available the summary notes “more available” and loads the next batch as you page through.
Export to CSV
Once the table has rows, an Export CSV download icon appears. Select it to download the rows as a CSV file. The export pages through the full filtered result, not just the rows already loaded on screen, up to a hard cap of 50,000 rows (the 100-rows-per-page preview is a separate, much smaller number).
A message naming the dataset and the number of rows confirms a normal export, for example “Participant register exported, 340 rows.” If the result hits the cap, the toast instead reads “dataset exported, first 50000 rows. Narrow the filters to export the rest.”, and the CSV stops at that row.
Note
Export CSV only shows for users who can create reports. A read-only user can run and read the table but cannot export it.
Tip
After a computed summary instead of raw records? The Insights tab has pre-built reports such as Worker hours, No-shows and Expiring worker checks.