Browse help topics
Run an insight
Choose a pre-built report, set the dates, run it and read the result.
Last updated · 2 August 2026
Insights are pre-built reports computed from your live data. You choose one, set a date range and any extra parameters, run it, and read the result on screen. You can then export it to CSV.
Open the Insights tab
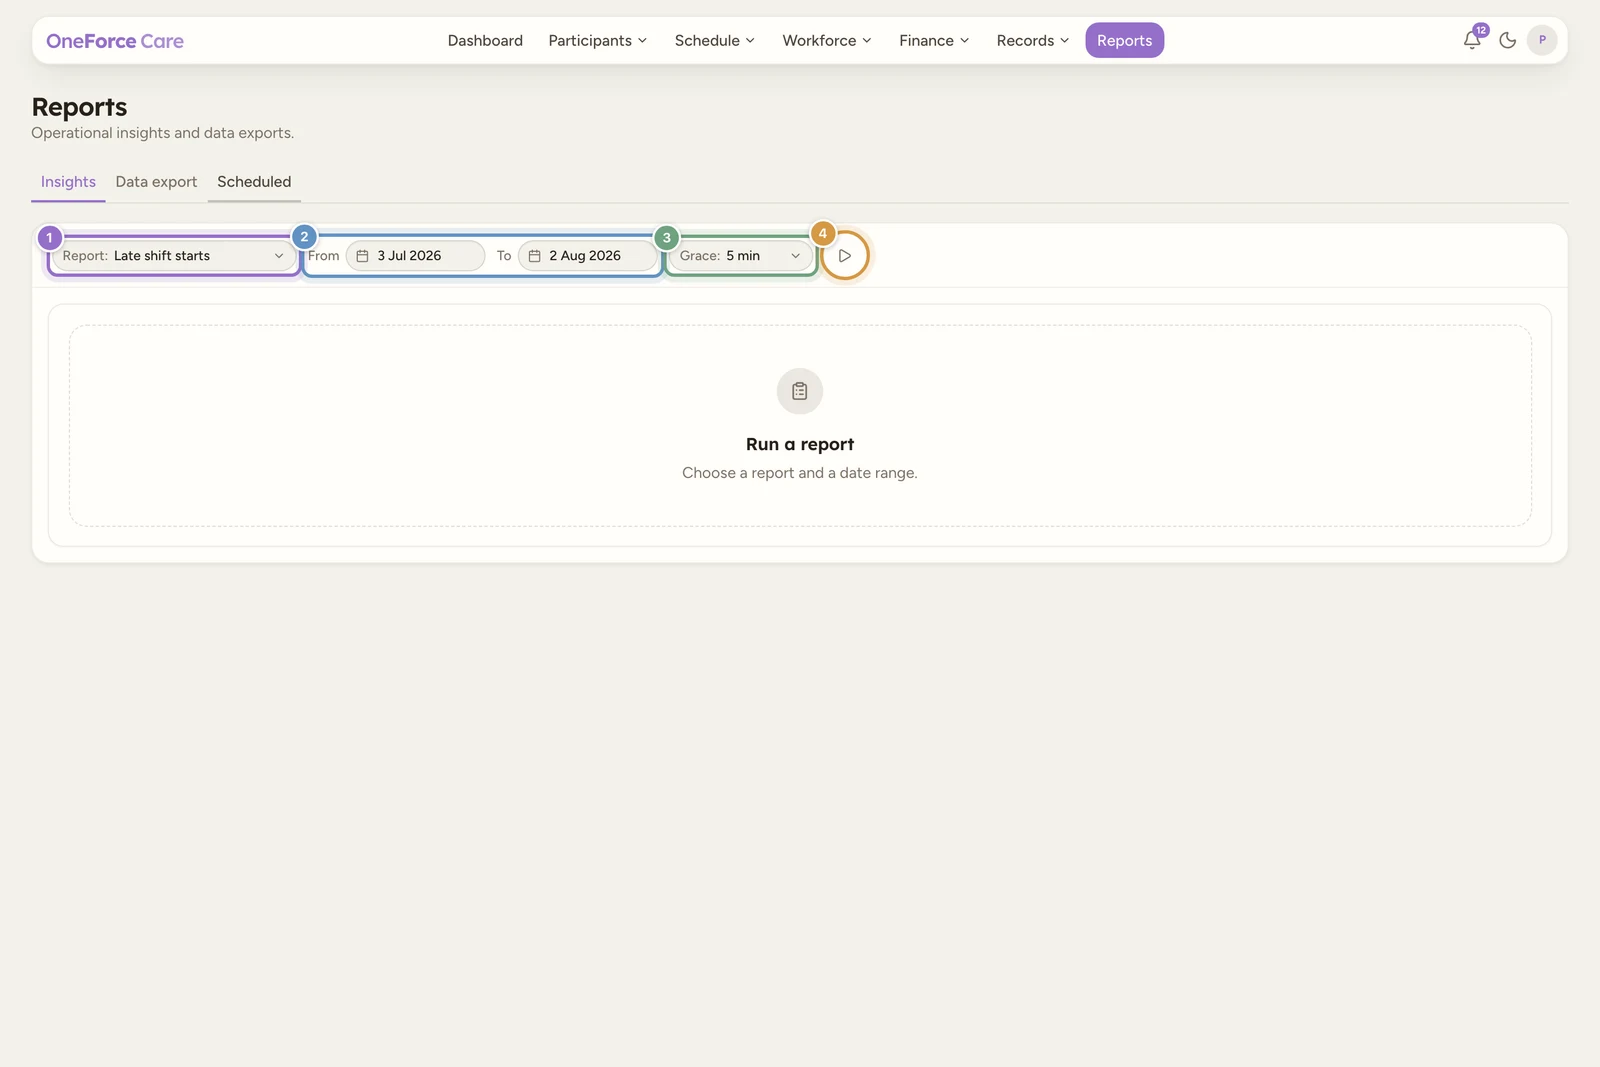
Go to Reports. The Insights tab is selected by default. Before you run anything you see a Run a report prompt: “Choose a report and a date range.”
Pick a report
Open the Report picker and choose a report. They are grouped by category. The first report, Late shift starts, is selected when you arrive.
| Category | Reports |
|---|---|
| Punctuality & attendance | Late shift starts, Early shift finishes, No-shows, Late / missing progress notes |
| Roster health | Unfilled shifts, Cancellations by notice band, Worker hours |
| Compliance & risk | Expiring worker checks, Open incidents, Overdue tasks |
| Service delivery & continuity | Support hours delivered, Under-serviced participants, Continuity of care |
| Trends over time | Shift volume per week, Incidents per month, Cancellation rate per week |
The three reports under Trends over time draw a bar chart. Every other report returns a table.
Set the date range and any parameters
Set From and To. They default to the last 30 days (From is 30 days ago, To is today). The range is capped at 366 days, so moving one date past the cap nudges the other to keep the window within a year.
Some reports add one extra parameter next to the dates. Only the parameter the chosen report needs appears:
| Parameter | Reports that use it | Choices (default) |
|---|---|---|
| Grace | Late shift starts, Early shift finishes | 0, 5, 10 or 15 minutes (5) |
| Within | Expiring worker checks | 7, 14, 30, 60 or 90 days (30) |
| At or below | Under-serviced participants | 0, 1, 2 or 5 hours (0) |
| Workers over | Continuity of care | 2, 3, 4, 5 or 6 (4) |
Note
If you set a From date that is after the To date, running is blocked with the message “The From date must be on or before the To date.” Fix the dates and try again.
Run the report and read the result
Select the Run report play icon. A skeleton shows while it runs, then the result appears with a line counting how many rows it returned:
- Table reports list the matching records in a table.
- Trend reports draw a bar chart, with the period along the bottom.
If nothing matches, you see Nothing to show: “No records matched this report for the selected period.” Widen the date range or adjust the parameters and run it again.
Export to CSV (optional)
Once a report has been run, an Export CSV download icon appears next to Run, whether or not it returned any rows. Select it to download the result as a CSV file; a message confirms how many rows were exported.
Note
Export CSV only shows for users who can create reports. If you can run a report but do not see the download icon, you have read-only access and cannot export.
Tip
Need a wider pull of raw records rather than a computed summary? Use the Data export tab to build a custom table and export it.