Browse help topics
Reports overview
Three tabs: pre-built Insights, a custom Data export builder, and Scheduled reports emailed to your team.
Last updated · 2 August 2026
Reports turns your live data into operational insights, exports and scheduled emails. Open it from Reports in the top navigation. The page is headed Reports with the subtitle “Operational insights and data exports.” and splits into three tabs.
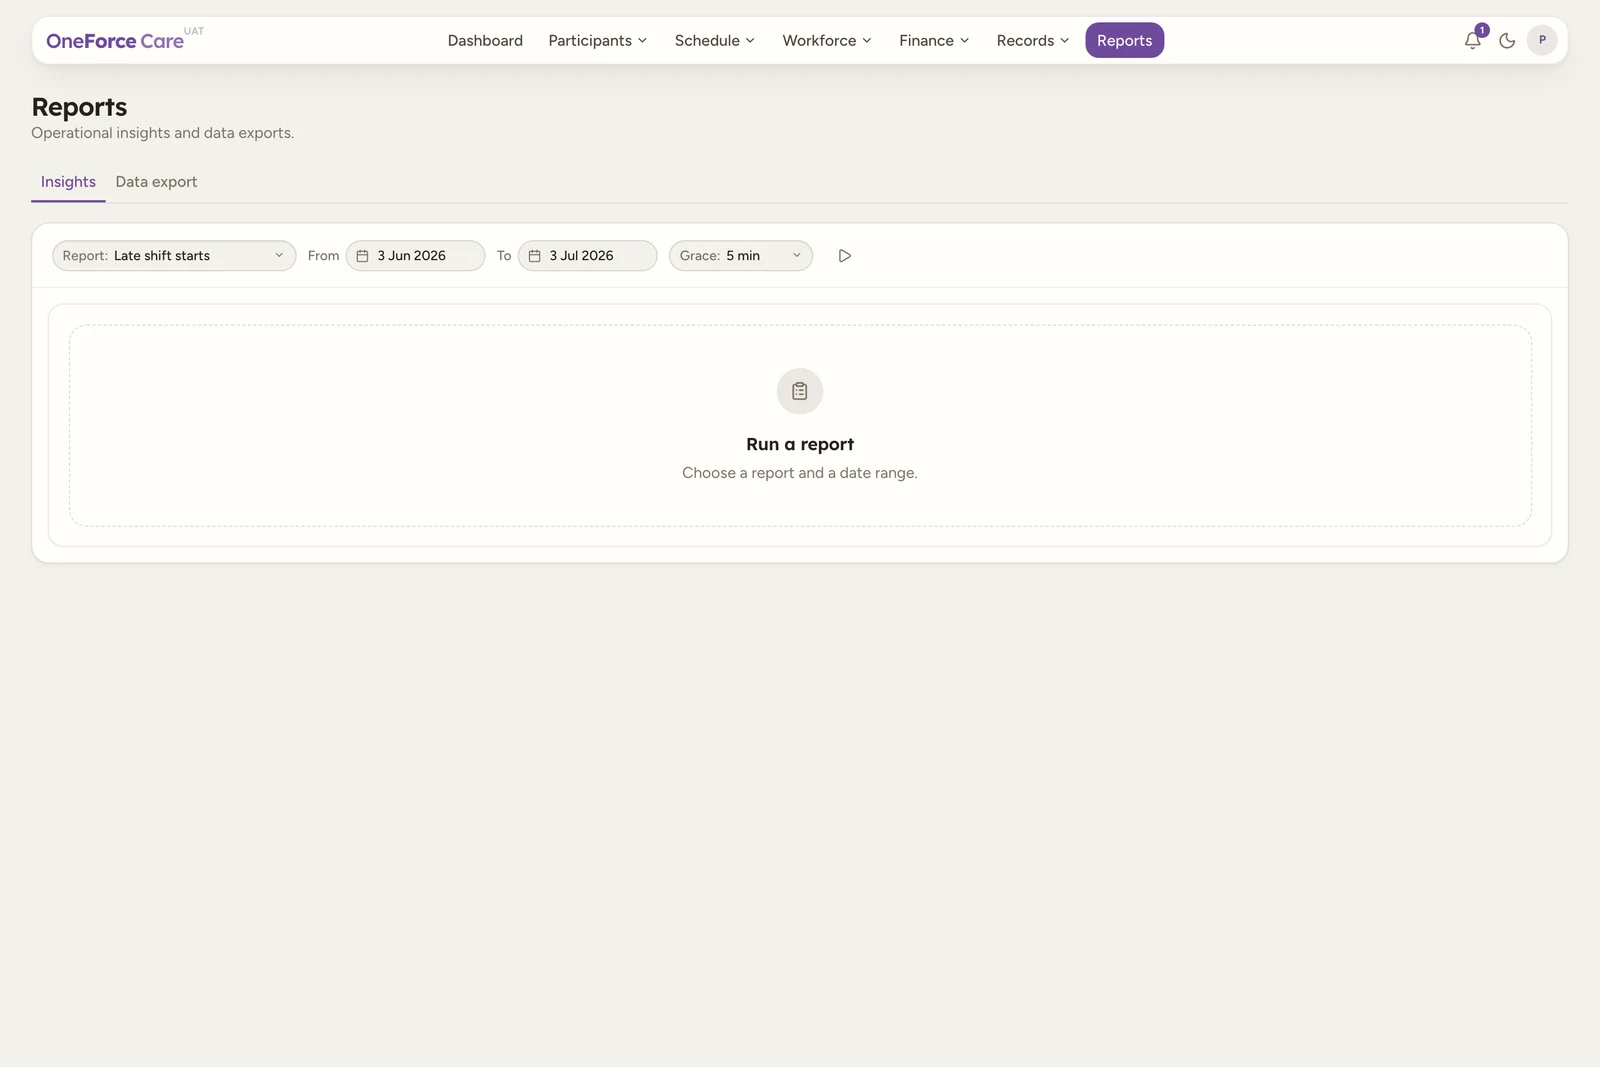
The three tabs
| Tab | What it does |
|---|---|
| Insights | Pre-built, computed reports chosen from a grouped picker (for example Late shift starts, No-shows, Worker hours, Expiring worker checks, Open incidents, Overdue tasks, Support hours delivered, plus trend charts). You set a date range and any per-report parameters, then run it. The result is a table or, for trend reports, a bar chart. |
| Data export | A custom builder. You pick a dataset (such as Participant register, Worker directory or Invoice batches), choose the columns and any filters, preview the table, then export it to CSV. |
| Scheduled | Standing schedules that email a report to a list of people on a weekly, fortnightly or monthly cadence, with the result attached as a CSV. |
Insights and Data export preview results on screen, and exporting to CSV is a separate step on each. Scheduled reports send themselves.
Note
Viewing Reports needs the reports read permission. The Export CSV button only appears for users who can also create reports, so a read-only user can run and read a report but not export it. On the Insights tab it appears as soon as a report has been run, even one that legitimately returns 0 rows, it is not gated on there being any rows to export. The same permission governs New schedule on the Scheduled tab.
Where to go next
- Run an insight walks through picking a pre-built report and reading the result.
- Export data to CSV covers the Data export builder end to end.
- Scheduled reports sets a report to email itself to your team.